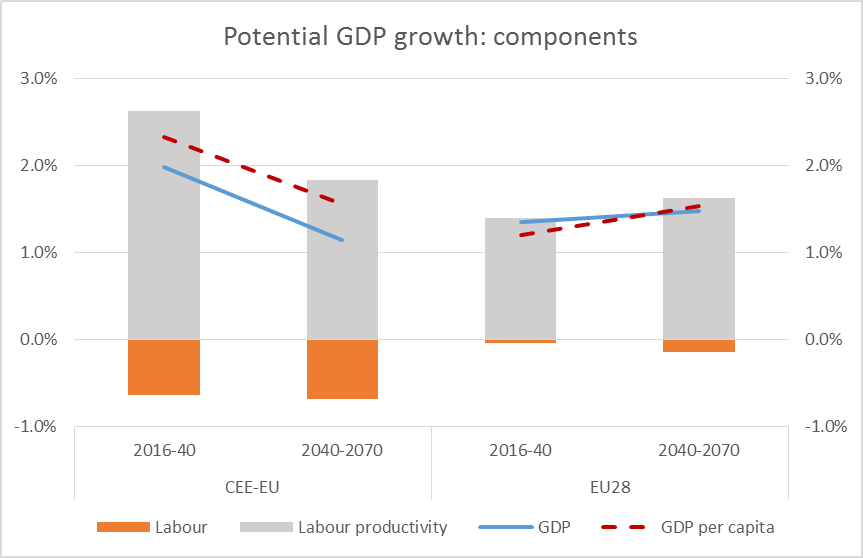
Emerging Europe
Emerging Europe

Graph 3

September 10, 2018
1 Min Read
Craig Turp-Balazs
Graph 3
Craig Turp-Balazs Craig Turp-Balazs
@bucharestlife
    Share This!
  • Twitter
  • LinkedIn
  • Facebook
  • ReddIt
Graph 3: Potential GDP growth and its components, 2016-70, annual average per cent change. Source: 2018 Ageing Report

    Share This!
  • Twitter
  • LinkedIn
  • Facebook
  • ReddIt
ISSN 2399-7613
© Emerging Europe All Rights Reserved 2013-2025